PlotJuggler: three documented install platforms, and macOS is not one of them
The Time Series Visualization Tool that you deserve.
At a glance
- What is it?
- A multi-modal time series viewer whose install section covers Windows, Debian family and a portable AppImage, while its data source table puts ROS 1 in one row and not the other. The version numbering, the apt repository's architecture, and a plugin system delivered through a menu item are the details worth having before you install.
- Who is it for?
- Use it if you are already on Windows, on Debian or Ubuntu, or on any Linux with a recent enough glibc, and if your data is time series plus the media that has to stay synchronised with it. That is exactly the case the format list was built for, from ROS 2 and Lab Streaming Layer on the live side to MCAP, Parquet, ULog and point clouds on the file side.
- Can I use it commercially?
- Yes, with conditions. MPL-2.0 is a weak copyleft licence: you can use it inside commercial and closed-source software, but if you distribute changes to its own files, you must publish those changes under the same licence.
- Is it still maintained?
- Yes. The repository received new commits within the last day.
- What is it written in?
- Mainly C++, according to GitHub's language statistics.
Answers come from the project's GitHub data, last synced on November 14, 2026, and from our analysis. They are not legal advice.
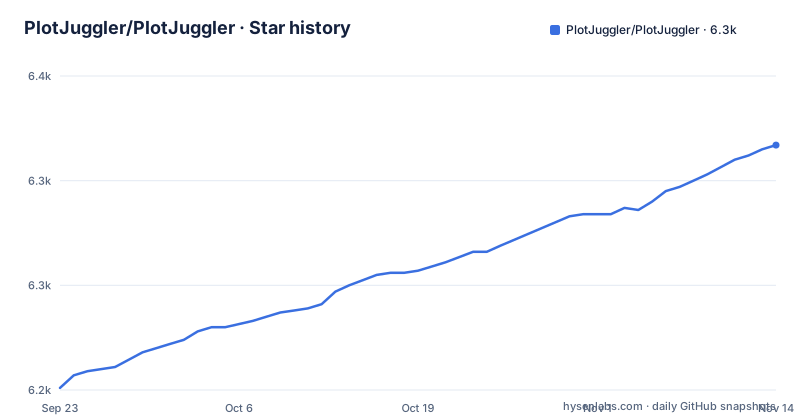
Star history
- PlotJuggler/PlotJuggler6,317 ★ · +116
| Repository | 2026-09-23 | 2026-11-14 |
|---|---|---|
| PlotJuggler/PlotJuggler | 6.2k | 6.3k |
116 Stars in the last 52 days, measured from the daily GitHub snapshot. Compare with other projects
Editorial analysis
The default branch is named after the version, and the betas sorted themselves below it
The repository's default branch is not called main. It is called `main-4.x`, which tells you two things at once: the project ships a line per major version, and the branch you land on by opening the repository is the version 4 line rather than the whole project.
The release history shows the same thinking applied to version numbers. Before 4.0.0 there are two releases numbered 3.999.9 and 3.999.3, named as beta three and beta two of version 4. So the betas of the next major were published under version numbers just below the previous major, which makes them sort correctly in any tool that orders versions numerically, rather than above 4.0.0 where a user upgrading would be surprised.
That is a deliberate choice and it worked: 4.0.0 was published on 2026-09-21, the betas on 2026-08-10 and 2026-07-20. The default branch was pushed on 2026-10-01, so the 4.0 line has been receiving work since the release.
The other marker of a version transition is the naming inside the project itself. The package installed from the apt repository is called `plotjuggler4`, the deb file name carries a 4, the install script carries a 4, and the data package names all carry a 4 prefix. Nothing here is a bare plotjuggler, which matters if you have scripts that invoke it by name.
The install section covers three platforms, and macOS is not one of them
The getting started section opens by saying every build is attached to the latest release and inviting you to pick the one that fits your system. Then it names Windows, Debian and Ubuntu, and any Linux distribution through a portable image, and it points at a build from source document for everything else.
Three platforms, and no macOS heading among them. That is the notable gap, because the application's own site is where most people meet it, and the readme's framing suggests completeness rather than a subset. A Mac user reading this has two options and no guidance: build from source using a document that is not reproduced here, or find the artifact some other way.
The three documented paths do differ in what they promise. The Windows build is a single executable that installs for the current user, so no administrator rights are needed, which is the friendliest of the three. The Debian and Ubuntu path is an apt repository rather than a file, so future releases arrive with an ordinary upgrade. The portable image needs to be made executable before it runs.
So the three paths differ in architecture, in permission model and in how upgrades arrive, and none of them mentions the platform the surrounding documentation is silent about.
The apt repository is amd64 only, and the by hand package never upgrades
The repository line this project asks you to add is specific about architecture:
sudo apt update && sudo apt install plotjuggler4That install comes from a sources line pinned to one architecture, and the package file name carries the same marker. The portable image for other Linux distributions is likewise named for one architecture. So on an arm64 Linux machine there is no named artifact in this document for either route, and the only remaining path is the source build.
The other half of this is a warning the project volunteers about its own convenience. There is a second Debian install: download a single release's package file and install it with a local path. The document then states plainly that a package installed that way is not updated by apt upgrade. That is the correct thing to tell someone, because the failure mode is silent: no error, no held packages, just a binary that stops receiving fixes while the machine keeps reporting the package as current.
The portable image has its own floor, stated as a glibc version with the distributions named as equivalents. Combined with the architecture pins, that gives a Linux reader three things to check before downloading anything: processor architecture, C library version, and which of the two install routes they are on, because only one of them keeps receiving updates.
The installer pipes into a root shell, and its own steps are written out below it
The recommended Debian and Ubuntu install is a single line that fetches a script from the project's own apt host and pipes it into a shell with root privileges:
curl -fsSL https://apt.plotjuggler.io/pj4_install.sh | sudo shThat is the shape of install command reviewers dislike, and rightly so: nothing in the command says what will run. What makes this one defensible is that the document then shows the work. A collapsed section offers to let you run the steps yourself, and spells out exactly what the script does: create the keyring directory with a fixed mode, download the archive keyring file into it, write a sources line pointing at the project host with that key as the signer, and then update and install.
So a reader can either trust the script or perform four commands by hand and end up in the same state. The script itself is also named as a path in the repository, under the packaging directory, so the thing being piped is something you can read before running it.
The failure mode if the host is ever unavailable is worth knowing: the fallback is the source build, not a different installer.
ROS 1 appears as a message encoding but not as a stream source
The data sources are laid out as four rows, and one row is more careful than the rest. Files covers CSV, MCAP, Parquet, the flight log format from one drone stack, a robot learning dataset format, MP4, and two point cloud formats. Live streams covers ROS 2, MQTT, ZeroMQ, UDP, WebSocket bridges, WebRTC and Lab Streaming Layer. Message encodings covers ROS 1 and ROS 2, Protobuf, JSON, CBOR, BSON, Apache Arrow and MessagePack. Cloud storage has a single entry, and it is a product with its own site.
ROS 2 appears in both the stream row and the encoding row. ROS 1 appears only in the encoding row. So the document promises support for reading ROS 1 messages while listing ROS 2 alone among the things you can connect to live.
Whether that is a deliberate deprecation or a leftover is not stated, and the readme does not say. What it means practically is that a reader with a ROS 1 system looks in the stream row, does not find it, and has to work out from the encoding row that the support is message level rather than connection level.
The point cloud entries are worth pairing with the 3D rendering table, which lists point clouds including compressed ones, meshes, robot models in a standard description format, two dimensional occupancy grids and maps, elevation grids, and annotations, trajectories and markers. The file formats and the renderers line up, which is what makes the multi-modal claim concrete rather than decorative.
The screenshots are in an HTML comment, so the rendered page has none
The readme's opening section describes the tool in a sentence, then carries a comment block containing three image URLs for original screenshots of a 3D scene, a plotting view and a vehicle view.
They are inside an HTML comment, so a rendered page shows nothing there. Nothing replaces them: the next heading goes straight to the interactive analysis section, which is all prose and bullet points.
That is a deliberate trade in one direction and an unfortunate one in the other. For a visual tool, the images are the fastest way to convey what the thing looks like, and the URLs being present means the author expected to restore them. For a reader, the feature list has to carry the whole argument on its own, which it mostly does: drag signals into plots, align several recordings to compare runs, filter and integrate signals, take fast Fourier transforms, define derived series in two scripting languages, and save layouts.
The rest of the presentation is consistent with that. The multimodal section is an HTML table with two cells rather than an image, and the list under each cell is specific about formats and codec families, including three video codecs and the transport used for live video.
Twelve modules, two dependency managers and six platform scripts
The repository root describes the architecture by naming it, with twelve module directories whose names map onto the features described above: the application, the data store, the plotting, the 2D and 3D scenes and the shared scene code, the runtime, the widgets, the marketplace, the scripting host, and a dialog host. Reading the list against the feature list tells you where each capability lives.
Around those are the build files, and there are two dependency systems rather than one. A conan file with a lock file sits next to a pixi manifest, so C++ dependencies and Python environment management are both in play, plus a versions file and a recipes directory. Vendored third party code arrives by two routes as well, since there is both a third party directory and a gitmodules file.
Platform coverage is handled with six small scripts, a shell and a batch file each for building, running and testing. That is what a codebase with Windows, Linux and macOS contributors looks like when the maintainer does not want a build system abstraction over three platforms.
The tooling files are equally explicit: formatting and lint configurations for the C++ side, a pre-commit configuration, a document on building from source, and both an assistant instruction file and a directory for it.
A format is supported once something is installed through the marketplace
Data support is not compiled in. The readme says to install ready made loaders, streamers and tools through a menu path in the application itself, under File, called the Marketplace. The root contains a module directory with that name.
Custom integrations go through a separate route: a plugin SDK in its own repository, and a repository of official plugins to start from. So there are three places involved, the application, the SDK and the plugin collection, and a format you need is a package you install rather than a build flag you set.
The cloud storage row is the exception that shows the shape. It has exactly one entry, and it links to a product with its own site rather than to a plugin. Which suggests the marketplace is also how a commercial or third party backend integrates, without that being stated.
For planning an installation, the practical consequence is that the feature list is not a capability list until you know what is in the marketplace. The readme does not enumerate what is available there, so the honest reading is that the formats named in the table are the ones you can expect to find, and the rest is a package manager away.
Editorial conclusion
Use it if you are already on Windows, on Debian or Ubuntu, or on any Linux with a recent enough glibc, and if your data is time series plus the media that has to stay synchronised with it. That is exactly the case the format list was built for, from ROS 2 and Lab Streaming Layer on the live side to MCAP, Parquet, ULog and point clouds on the file side. Before you commit, check three things. There is no macOS install path in this document at all, so on a Mac you are reading source build instructions or nothing. The apt repository is amd64 only, and the single release package you install by hand will never be updated by apt upgrade. And the plugins come from a marketplace inside the application plus two other repositories, so a data format is only supported once something is installed through it. Licence is MPL-2.0 with third party dependencies keeping their own. Last push was 2026-10-01, and version 4.0.0 was released on 2026-09-21.
Frequently asked questions
what is plotjuggler
PlotJuggler 4 is an open source multi-modal visualization platform for time series data, used to explore recorded or live data, compare test runs, and analyze and transform data in one application. Version 4 added images and video, 3D rendering including point clouds and robot models, and derived series written in Lua or Python. It is written in C++ and released under the Mozilla Public License 2.0.
How to install plotjuggler?
On Debian and Ubuntu the recommended route is an apt repository, added once with a script from the project's own apt host, after which future releases arrive with apt upgrade; the document also prints those same steps so you can run them yourself. Any other Linux distribution uses a portable AppImage that you make executable and run, and it needs glibc 2.35 or newer. Windows has a single installer that installs for the current user without administrator rights.
how to install plotjuggler on windows
Download the executable named for your version and the x64 architecture from the latest release page and run it. It installs for the current user, so no administrator rights are required. Every build is attached to the latest release, and the package name carries a 4 to mark the version line.
how to use plotjuggler
Drag signals into time series and XY plots, zoom into events and inspect individual samples, or load several recordings, align their timelines and overlay signals to compare runs. Analysis tools cover filtering, rate of change, integration and fast Fourier transforms, and you can add derived series with custom transforms in Lua or Python. Layouts and transforms can be saved, and additional formats are installed as plugins through File then Marketplace.
how to use plotjuggler with ros2
ROS 2 is listed among the live stream sources, installable through the marketplace inside the application, and both ROS 1 and ROS 2 are listed among the supported message encodings. The document does not walk through a ROS 2 connection step by step, so the supported route is to install the ROS 2 streamer as a plugin from File then Marketplace rather than to configure it from the main window.
Official sources
Add this badge to your README
If you maintain this project, the badge below links readers to this analysis and shows its maintenance status from the daily GitHub snapshot. Paste the markdown into your README; add ?metric=license or ?metric=stars to the image URL for a different field.

[](https://hysenlabs.com/projects/plotjuggler-plotjuggler)Star history chart for your README
[](https://hysenlabs.com/projects/plotjuggler-plotjuggler)Was this useful?