jealous/stockstats: Pandas Indicator Calculations for Stock Data
Supply a wrapper ``StockDataFrame`` based on the ``pandas.DataFrame`` with inline stock statistics/indicators support.
At a glance
- What is it?
- stockstats adds an indicator-aware `StockDataFrame` wrapper around `pandas.DataFrame`, with lazy column calculations for moving averages, momentum, trend, volatility, volume, and signals. It suits Python developers who already have OHLCV data and want calculations without manually building every pandas operation.
- Who is it for?
- Adopt stockstats when your application already stores price history as pandas OHLCV data and needs repeatable indicator columns or crossover signals. Do not choose it as a data provider, strategy engine, or replacement for explicit financial calculations when you need behavior not documented here.
- Can I use it commercially?
- Check first. The repository uses a licence we do not classify automatically, so read its LICENSE file before any commercial use.
- Is it still maintained?
- Yes. The repository last received commits 13 days ago.
- What is it written in?
- Mainly Python, according to GitHub's language statistics.
Answers come from the project's GitHub data, last synced on November 7, 2026, and from our analysis. They are not legal advice.
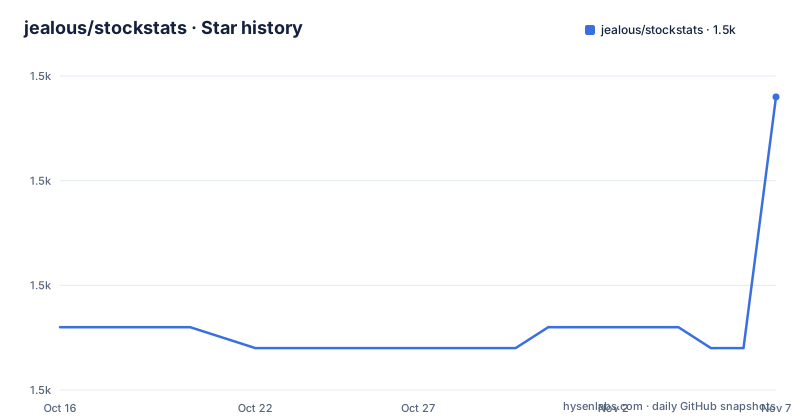
Star history
- jealous/stockstats1,534 ★ · +11
| Repository | 2026-10-16 | 2026-11-07 |
|---|---|---|
| jealous/stockstats | 1.5k | 1.5k |
11 Stars in the last 22 days, measured from the daily GitHub snapshot. Compare with other projects
Editorial analysis
Why stockstats wraps pandas.DataFrame
stockstats addresses a specific gap between ordinary tabular storage and repeated technical-analysis calculations. A Python process may already have daily price history with close, high, low, and volume columns, but converting that data into an RSI, Bollinger Band, MACD, or moving average usually requires a collection of formulas with different parameter conventions. The project supplies `StockDataFrame`, a wrapper around `pandas.DataFrame`, and allows calculated values to be requested through column names.
The intended audience is developers working with market data in Python, particularly applications that already depend on pandas and numpy. The package is not a market-data service. It does not download historical prices by itself, establish an investment strategy, or provide a backtesting engine. The README gives examples using CSV data and yfinance, but those are input paths for an application, not separate features of stockstats.
The design is especially useful for exploratory analysis and feature construction. A caller can keep the source columns in one DataFrame and request derived values as ordinary-looking columns. The trade-off is that a derived column is not an independent database record. It is calculated and cached within the wrapper, so column naming, input shape, and recalculation behavior become part of the application's data model.
Lazy indicator columns and their calculation flow
The core mechanism is column access. When a requested indicator column does not exist, stockstats calculates it and adds it to the wrapped DataFrame. Later access reads the existing column. The README states that deleting a column forces re-evaluation, which makes refresh behavior explicit for applications that alter input values or configurable parameters.
The most general naming pattern is `<column>_<window>_<indicator>`. For example, `close_20_sma` requests a 20-period simple moving average of the close column, while `high_10_ema` requests a 10-period exponential moving average of the high column. The README also documents `rsi_6` for a six-period RSI and `atr_13` for a 13-period ATR. Indicators with defaults can be requested through shorter names such as `rsi` or `boll`.
Some indicators generate multiple columns. Accessing `macd` produces `macd`, `macds`, and `macdh`, while `boll` produces `boll`, `boll_ub`, and `boll_lb`. This behavior matters for code that selects columns by name. A multi-line calculation is not represented by one opaque object, so downstream code can address each output separately.
The documented utility grammar also includes comparisons and crossings. `df['close_10_sma_xu_close_50_sma']` detects a crossover where the 10-period SMA crosses above the 50-period SMA. `df['rsi_ge_70']` returns a boolean-style comparison column. This approach makes derived conditions available through the same access interface as numeric indicators.
Installing stockstats and wrapping the first dataset
The README gives a direct PyPI installation command. The package metadata specifies Python 3.9 or newer and dependencies on numpy 1.16.6 or newer and pandas 0.24.2 or newer. After installation, a first use can begin with a CSV file whose headers contain the required price fields. The `date` field is optional, but the README says it is used as the index by default.
Install the package with:
pip install stockstatsFor a CSV-backed first calculation, the documented wrapper call is:
import pandas as pd
from stockstats import wrap

df = wrap(pd.read_csv('stock.csv'))
rsi = df['rsi']
The command installs the package and its declared dependencies. The code reads `stock.csv`, wraps its DataFrame, and requests the default 14-period RSI. The input column names are case-insensitive according to the README. The required fields are `close`, `high`, `low`, and `volume`; a missing field can make the relevant calculation unavailable.
The README also shows yfinance input while explicitly disabling its multi-level index:
import yfinance as yf
from stockstats import wrap

df = wrap(yf.download('AAPL', multi_level_index=False))
This example demonstrates compatibility with a DataFrame returned by yfinance. It does not add a yfinance dependency to the package metadata. The caller must install and manage any external downloader separately.
Moving averages, multi-line outputs, and signal columns
The indicator catalog is broad, but the access model is more important than the raw catalog size. Moving averages include SMA, EMA, SMMA, TEMA, LRMA, KAMA, VWMA, and DMA. The same wrapper can therefore support trend smoothing and comparisons without changing the underlying price table. For example, the documented crossover expression compares two moving averages that are themselves created as indicator columns.
Momentum and trend indicators include RSI, StochRSI, MACD, PPO, KDJ, ROC, CMO, KST, Coppock, AO, Supertrend, Aroon, Ichimoku, DMI, TRIX, and others. Volatility-related calculations include Bollinger Bands, ATR, TR, CCI, Williams %R, CHOP, KER, Z-Score, MAD, and PGO. Volume and oscillator utilities include VR, MFI, PVO, QQE, RVGI, ERI, and FTR.
The README warns that `init_all()` generates many columns. That shortcut is convenient when an application expects the full supported set, but it changes DataFrame width and memory use. It should be treated as an explicit schema choice rather than a harmless convenience.
Class-level configurable parameters add another constraint. The README says changes are global and do not affect existing results. Existing columns must be removed before the next access recalculates them. This behavior is manageable in a controlled pipeline, but it can surprise code that changes configuration while retaining stale derived columns.
Compatibility, licensing, and maintenance boundaries
The repository contains a single Python module, `stockstats.py`, plus packaging and test files. The `pyproject.toml` declares Python 3.9+, numpy, and pandas, and the README states that CI tests Python 3.10 through 3.13. The package therefore fits applications built around a supported pandas environment, although the project does not claim compatibility with every future pandas release.
The README labels the project BSD-3-Clause and links to `LICENSE.txt`. The repository metadata also identifies the package as BSD-3-Clause. Anyone redistributing the package or incorporating its code should read the actual `LICENSE.txt` file and preserve any notices and conditions that apply. This review does not interpret the license or provide legal advice.
The repository is not archived, and the last push was on 2026-09-28. Releases include v0.6.9 on 2026-09-28, v0.6.8 on 2026-02-16, and v0.6.7 on 2026-01-24. That indicates recent project activity, but it does not by itself guarantee compatibility with a particular pandas version. Upgrade cost depends on whether an application depends on generated column names, defaults, or undocumented behavior.
The package has no separate service deployment or database dependency in the documented installation path. Its maintenance burden is mainly Python dependency management and checking changes to indicator calculations and naming behavior.
When stockstats is the wrong tool
stockstats is the wrong choice when the application does not use pandas DataFrames or needs a complete trading platform. The repository provides a calculation wrapper, not exchange connectivity, corporate-action adjustment, order management, portfolio accounting, backtesting, or risk reporting. The README does not document any of those responsibilities.
It is also a poor fit when every calculation must be reproducible from an immutable, explicitly versioned formula outside the DataFrame. Cached columns are convenient for exploration, but a changed class-level parameter does not update existing values. A pipeline that silently retains stale indicators could produce inconsistent features unless it controls deletion and recomputation.
The input contract matters. `close`, `high`, `low`, and `volume` are required, while the default index behavior depends on a `date` field. A DataFrame from another provider with renamed fields, multi-level columns, or a different time representation may require normalization first. The yfinance example explicitly uses `multi_level_index=False`, which shows that the project expects a particular DataFrame shape.
For alternatives, an application can keep calculations as explicit pandas or numpy functions. That approach exposes each formula, window, and intermediate series directly, at the cost of writing and maintaining more code. stockstats instead uses a compact column vocabulary and lazy generated columns. The practical choice is between explicit control and concise indicator access, not between a data provider and an indicator library.
Editorial conclusion
Adopt stockstats when your application already stores price history as pandas OHLCV data and needs repeatable indicator columns or crossover signals. Do not choose it as a data provider, strategy engine, or replacement for explicit financial calculations when you need behavior not documented here. Verify first that your column names and index match the documented input model, then inspect the generated values for your chosen windows and remove columns when configuration changes require recalculation.
Frequently asked questions
How do I install stockstats?
The README documents `pip install stockstats`. The package requires Python 3.9 or newer and depends on numpy and pandas.
How do I calculate RSI with stockstats?
Wrap a DataFrame with `wrap` and access `df['rsi']` for the default 14-period RSI. Use `df['rsi_6']` for a six-period calculation.
How do I recalculate an indicator in stockstats?
The README says to delete the generated column. The next access recalculates it. Changes to class-level configurable parameters do not affect existing results.
Official sources
Add this badge to your README
If you maintain this project, the badge below links readers to this analysis and shows its maintenance status from the daily GitHub snapshot. Paste the markdown into your README; add ?metric=license or ?metric=stars to the image URL for a different field.

[](https://hysenlabs.com/projects/jealous-stockstats)Star history chart for your README
[](https://hysenlabs.com/projects/jealous-stockstats)Was this useful?