The Vectara hallucination leaderboard is a table in a README, and three rows are out of order
Leaderboard Comparing LLM Performance at Producing Hallucinations when Summarizing Short Documents
At a glance
- What is it?
- vectara/hallucination-leaderboard publishes per-model hallucination rates for summarization, computed with the vendor's own HHEM model. Its factual consistency column is the exact complement of the rate beside it, the answer rate varies enough to change what the ranking measures, and the sort order breaks in three visible places.
- Who is it for?
- Use this leaderboard as a starting point for short document summarization and not as a general accuracy ranking, because what it measures is one vendor's model judging summaries of one kind of input. Three things to weigh before you quote a number.
- Can I use it commercially?
- Yes. Apache-2.0 is a permissive licence: you can use, modify and sell software built on it, as long as you keep its copyright and licence notices.
- Is it still maintained?
- Yes. The repository last received commits 23 days ago.
- What is it written in?
- Mainly Python, according to GitHub's language statistics.
Answers come from the project's GitHub data, last synced on November 15, 2026, and from our analysis. They are not legal advice.
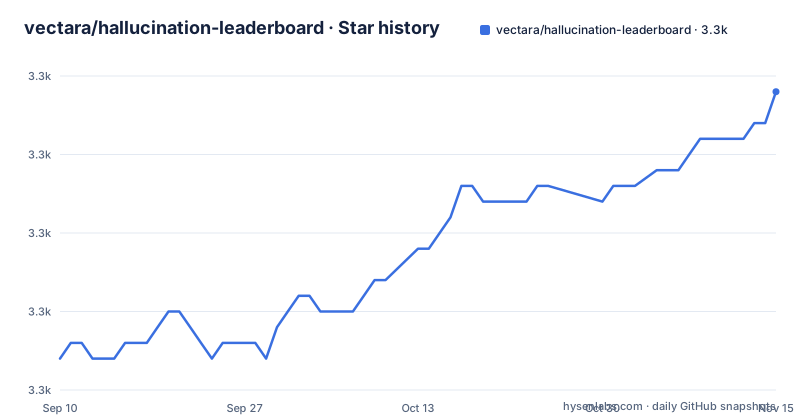
Star history
- vectara/hallucination-leaderboard3,329 ★ · +17
| Repository | 2026-09-10 | 2026-11-15 |
|---|---|---|
| vectara/hallucination-leaderboard | 3.3k | 3.3k |
17 Stars in the last 66 days, measured from the daily GitHub snapshot. Compare with other projects
Editorial analysis
The repository holds a table, a licence and a citation file
The whole project is four top level entries: README.md, LICENSE, CITATION.cff and an img directory. There is no dataset, no evaluation script and no Python source in the listing, even though the repository's primary language is reported as Python. The leaderboard itself is a Markdown table embedded in the README between a LEADERBOARD_START marker and its counterpart, which is the shape used by tooling that regenerates the block automatically. That tooling is not in this repository, so the numbers arrive by some process the repository does not show. There are no GitHub releases either, and the last push to the main branch is dated 2026-09-23, one day after the line inside the table that says it was last updated on September 22, 2026. Nothing here is versioned, so a row you saw last month cannot be recovered from a tag. The one other document in the root, CITATION.cff, points at the same class of artifact: a citation record for the leaderboard rather than for the model or the data behind it. Read together, the four entries describe something closer to a published report that happens to live in a repository than to a tool you can run, which is also why the interactive version sits on Hugging Face instead of being started from this checkout.
Factual consistency is the complement of the rate beside it
The table has five columns: model, hallucination rate, factual consistency rate, answer rate and average summary length in words. The second and third are the same number twice. Every row adds up to exactly 100: finix_s1_32b is 1.8% and 98.2%, gpt-5.4-nano-2026-03-17 is 3.1% and 96.9%, gpt-6-astra is 8.7% and 91.3%, grok-4-fast-non-reasoning is 19.7% and 80.3%. So factual consistency rate is derived by subtraction rather than measured, and it carries no information the column to its left does not already carry. That matters when the table is quoted: a claim of 98.2% factual consistency is the same claim as 1.8% hallucination, and reading the second column as an independent corroboration of the first is double counting.
The answer rate column changes what the ranking measures
Answer rate is the most consequential column and the one most often left out when a row is quoted. It ranges from 100.0%, recorded for several models including gpt-5.4-mini-2026-03-17, granite-4.0-h-small and claude-opus-4-6, down to 62.7% for snowflake-arctic-instruct, with microsoft/Phi-4 at 80.7%, google/gemma-3-4b-it at 67.3% and CohereLabs/c4ai-aya-expanse-8b at 77.5%. The ranking is by hallucination rate alone. A model that declined two of every five requests is therefore placed in the same list as one that answered everything, and its hallucination rate is computed over the subset it did answer. Nothing in the table says so, and the interactive version on Hugging Face is the place to check how a row was produced. It also means two numbers that look comparable are not. A 6.4% rate on 67.3% of prompts rests on a smaller sample than a 6.1% rate on 99.9% of them, and the table gives no confidence interval, no sample count and no note about how refusals were handled, whether they were dropped before scoring or counted as correct. For an application choosing between two models, that column is the first thing to read and the last thing most write-ups mention.
Three rows break the sort order
The table is meant to be read in ascending hallucination rate, and mostly is. Three rows do not follow. CohereLabs/command-r-plus-08-2024 is listed at 6.9% directly above openai/gpt-6-sol at 6.5%. mistralai/ministral-8b-2410 appears at 7.4% after openai/gpt-6-astra at 8.7%. And openai/gpt-5.6-sol at 12.4% is placed above openai/gpt-5.1-high-2025-11-13 at 12.1%. Since the block is generated and committed, those three positions came from an edit rather than from a sort, which tells you the ordering is maintained by hand. Anyone who reads rank from row position, or who takes the first model in a family as the family's best, will get the wrong answer for those entries.
Dated snapshots and floating aliases share one column
The model names mix two kinds of thing. Some are pinned snapshots with a date suffix, such as openai/gpt-5.4-nano-2026-03-17, openai/gpt-4.1-2025-04-14 and qwen/qwen3.5-plus-2026-02-15. Others are untagged names that can move under you, such as google/gemini-2.5-flash-lite, openai/gpt-oss-120b and the two gpt-6 entries named gpt-6-sol and gpt-6-astra. Comparing a pinned March snapshot against a floating alias means the table mixes model identity and model version. Within single families the differences are visible too. The reasoning effort pairs separate: gpt-5.2-low-2025-12-11 sits at 8.4% while gpt-5.2-high-2025-12-11 is 10.8%, and grok-4-1-fast-non-reasoning at 17.8% differs from grok-4-1-fast-reasoning at 19.2%.
Nearly identical names sit eleven rows apart
One pair deserves care because a reader will assume it is a typo. openai/gpt-5-mini-2025-08-07 is recorded at 12.9% with an average summary of 169.7 words, and openai/gpt-5-minimal-2025-08-07 at 14.7% with 109.7 words. Same vendor, same date suffix, one extra syllable in the name, and both are in the table as separate entries. If the distinction is not documented anywhere you can see, treat the two as unverified neighbours rather than assuming one is a variant of the other. The o4-mini pair behaves differently again, with low and high at an identical 18.6% each and average summary lengths of 130.9 and 127.7 words, so effort level moved nothing in that case.
The judge is the vendor's own model
The leaderboard is computed using Vectara's Hallucination Evaluation Model, known as HHEM, and the repository's homepage is vectara.com. So the scores are produced by a model from the company publishing the table, which is a fact about provenance rather than a defect, and worth stating whenever a row is quoted. The versioning is where the detail is missing. The two earlier leaderboards are preserved on named branches, hhem-1.0-final for the first version based on HHEM-1.0 and hhem-2.3-old-dataset for a more recent one computed on the previous dataset, and those branch names tell you the judge and the data both changed. The current table names neither an HHEM version nor a dataset size, so a reader cannot tell which judge produced it or how many documents it saw.
Summary length varies tenfold and is not ranked
Average summary length is reported in words and spans from 54.7 for openai/gpt-5.4-mini-2026-03-17 to 254.4 for openai/gpt-5.1-high-2025-11-13, with moonshotai/Kimi-K2-Instruct-0905 at 59.2 and mistralai/ministral-8b-2410 at 196.0. The best scoring row is also among the longest: antgroup/finix_s1_32b at 1.8% produces summaries averaging 172.4 words. Length is a real difference in what a model does, and it is not part of the ordering, so the table implicitly compares a terse model and a verbose one on the same axis. Whether verbosity helps or hurts under a hallucination judge is not something the table reports, and the rate alone does not tell you which summary a user would prefer.
Editorial conclusion
Use this leaderboard as a starting point for short document summarization and not as a general accuracy ranking, because what it measures is one vendor's model judging summaries of one kind of input. Three things to weigh before you quote a number. The judge is HHEM, made by the same company whose homepage the repository points at, and the table names neither the HHEM version nor the dataset size, so two rows from different dates may not be comparable. The answer rate column shows that some models decline most requests, and a hallucination rate computed over a fraction of the prompts is not the same measurement as one computed over all of them. And the rows are sorted by hand, so position in the table is not a rank. For previous judgements, two earlier versions are kept on branches, and the interactive version lives on Hugging Face.
Frequently asked questions
What is the Vectara Hallucination Leaderboard?
It is a public leaderboard scoring how often an LLM introduces hallucinations when summarizing a document, computed with Vectara's Hallucination Evaluation Model, known as HHEM. Each row gives a model name, a hallucination rate, a factual consistency rate, an answer rate and an average summary length in words, and the table states it was last updated on September 22, 2026.
How does the hallucination leaderboard treat models that refuse to answer?
It records that separately in the answer rate column, which ranges from 62.7% for snowflake-arctic-instruct to 100.0% for several models, with microsoft/Phi-4 at 80.7% and google/gemma-3-4b-it at 67.3%. The ordering itself is by hallucination rate alone, so a low answer rate is not visible in a model's position.
Where is the data or code behind the Vectara hallucination leaderboard?
Not in the repository. The top level contains four entries: README.md, LICENSE, CITATION.cff and an img directory. The table is embedded in the README between LEADERBOARD_START and LEADERBOARD_END markers, and no dataset or evaluation script appears in the file listing, even though the repository's primary language is reported as Python.
Can I see previous versions of the hallucination leaderboard?
Yes, on branches. The first version, based on HHEM-1.0, is kept on the hhem-1.0-final branch, and a more recent version computed on the previous dataset is on hhem-2.3-old-dataset. An interactive version of the leaderboard is also hosted as a Hugging Face space.
Is factual consistency rate different from hallucination rate on the leaderboard?
In the published table the two columns are exact complements. finix_s1_32b shows 1.8% and 98.2%, and every row sums to 100, so the factual consistency column is derived from the hallucination column rather than measured separately.
Official sources
Add this badge to your README
If you maintain this project, the badge below links readers to this analysis and shows its maintenance status from the daily GitHub snapshot. Paste the markdown into your README; add ?metric=license or ?metric=stars to the image URL for a different field.

[](https://hysenlabs.com/projects/vectara-hallucination-leaderboard)Star history chart for your README
[](https://hysenlabs.com/projects/vectara-hallucination-leaderboard)Was this useful?