CPA Usage Keeper tracks quota per credential, and its default configuration listens on every interface
Standalone CliProxyAPI usage tracker with SQLite persistence and built-in dashboard.
At a glance
- What is it?
- CPA Usage Keeper is a Go dashboard for CLIProxyAPI that persists request history in SQLite, breaks cost down by model and key, and manages credential quotas on the proxy it watches. It is the kind of tool that holds a management credential for the thing it monitors, and its shipped defaults are worth reading before you expose it.
- Who is it for?
- Start from what this thing holds, because that determines where it belongs. It is configured with the proxy's management key, it records per key and per provider usage, it can export request details, and by its own feature list it can refresh quotas and change credential priorities on the proxy.
- Can I use it commercially?
- Yes. MIT is a permissive licence: you can use, modify and sell software built on it, as long as you keep its copyright and licence notices.
- Is it still maintained?
- Yes. The repository received new commits within the last day.
- What is it written in?
- Mainly Go, according to GitHub's language statistics.
Answers come from the project's GitHub data, last synced on November 14, 2026, and from our analysis. They are not legal advice.
Star history
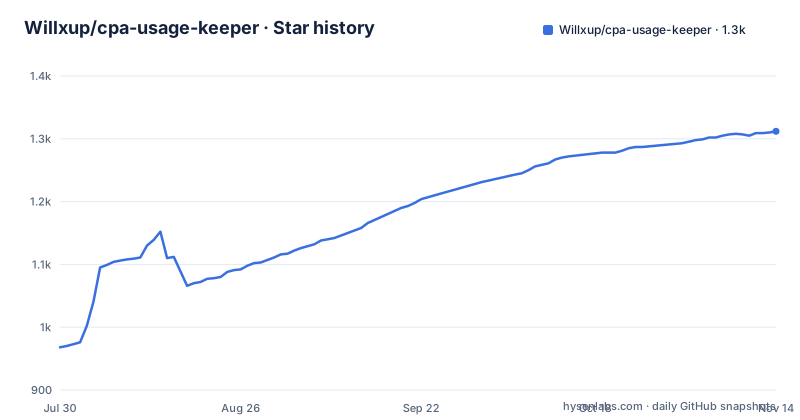
- Willxup/cpa-usage-keeper1,312 ★ · +344
| Repository | 2026-07-30 | 2026-11-14 |
|---|---|---|
| Willxup/cpa-usage-keeper | 968 | 1.3k |
344 Stars in the last 107 days, measured from the daily GitHub snapshot. Compare with other projects
Editorial analysis
It holds the proxy's management key, so it is not a read-only observer
The first configuration value in the example environment file is the address Keeper uses to reach the proxy, and the second is a management key for that proxy. Both are marked required, and the placeholder value in the file is a literal instruction to replace it.
Now line that up against the feature list. The dashboard persists usage history in a SQLite database with scheduled backups, breaks usage, caching, and estimated cost down by model, by API key, and by provider, and lets you inspect and export request details alongside success rates, time to first token, and total latency. That half is observation.
The other half is control. The quota section says you can monitor credential health and remaining quota, refresh quotas, edit priorities, and explore a quota history for one provider. So the tool can change the order in which the proxy uses its credentials and can tell the proxy to go and re-read its quota.
That is a coherent design for an operator who wants one place to watch a proxy and nudge it. It is also a different security posture from a dashboard, and the two should not be confused: a service holding a management key for another service is a control plane component, and it belongs on the same network as the thing it controls rather than on a shared one.
The one genuinely read-only feature is worth noting too, because it is the safest thing here: a scoped usage view for a single API key, which is a reasonable way to let one person see their own spend without handing over the dashboard.
The listen host ships empty, and the note tells you how to narrow it
The second section of the example environment file is about web access and reverse proxying, and it is written in both Chinese and English. That alone is unusual and useful.
The first variable is the HTTP listen host, and it is empty by default. The comment says an empty value preserves the existing behaviour of listening on all available interfaces. Then it splits the advice: a native deployment can set it to loopback for local-only access, while a container deployment should leave it empty and restrict access through the published host port instead.
That is a considered answer rather than an oversight, since it names the two deployment shapes and gives different guidance for each. It also means the security boundary is the port mapping in your compose file, not the application, and a deployment that publishes the port broadly has published the dashboard broadly.
The rest of the section is ordinary and worth having in one place. The port defaults to 8080. A base path variable serves the app from the root when empty, must start with a slash when set, and has its trailing slash normalised, so a subpath deployment is a supported shape rather than an accident. And a public proxy URL variable exists for a back link, defaulting to the current page's own origin with the proxy's management page appended, which tells you the proxy serves its admin interface as a single page from the same host.
Login protection is on by default, with one documented way to turn it off
The quick start makes a point of this that most projects leave implicit: login protection is enabled by default, and you are told to configure a login password before starting the service.
The escape hatch is a single environment variable set to false, and the sentence attached to it is the part that matters. It should only be done when access is already reliably isolated by the deployment environment. That is a condition rather than an instruction, which means the person turning protection off is being asked to have already answered the question the switch asks.
The access model is otherwise layered. The repository has a package for sessions and access control, separate from the HTTP routing package and from the application wiring, so authentication is a component with its own boundary rather than middleware in one handler. And the scoped sharing feature means access can be granted per API key, so not every person who needs to see usage needs the dashboard's own login.
Combined, that is three levels: a default-on login, a documented exception with a condition, and a narrower sharing mechanism for a specific case. It is a better answer than a single on and off switch, and it is written down.
Collection stops rather than degrades if the proxy is not configured first
The quick start opens with two warnings, and both are about the upstream rather than about Keeper.
The first is that usage statistics have to be enabled on the proxy before Keeper can record anything. The setting moved: in current configurations it lives under an observability and usage prefix, while older configurations use a top-level key of the same name. So an upgrade path that ignores the move produces an empty dashboard with no error in Keeper at all.
The second warning is sharper. When several usage collectors share one proxy instance, the page says to make sure they all use the same subscription mode, and that otherwise collection may stop or become incomplete.
That is the design decision to notice. The failure mode is silent loss of data rather than a partial feed or a visible warning, and incomplete collection in a cost dashboard is worse than no dashboard, because the number still looks authoritative. If you run more than one collector, or if you add one later, this is the setting to check before you trust a total.
Both warnings are the kind of thing that would normally live in a support thread. They are in the quick start instead, which is where they belong.
Six deployment paths across four distribution channels
The deployment matrix is the most thorough part of the page, and it answers a question most projects leave to inference.
For a new deployment there is a compose file that brings up both the proxy and the dashboard. For an existing proxy there is a keeper-only compose stack, which assumes you already have the proxy's address and management key and only need to add the dashboard. For the same case with a preference for running containers directly there is a plain run recipe. And then the three non-container paths: Homebrew on macOS, a Linux binary for machines without containers, and a Windows binary.
Architectures are given per row. Both compose paths and the container run target amd64 and arm64 on Linux. The macOS, Linux binary, and Windows rows each cover amd64 and arm64, so Windows on ARM is covered by a binary rather than a container, which follows from the build needing cgo.
The distribution channels are wider than that. The page links a releases page, a container package registry, a continuous integration workflow badge, and a separate repository holding the Homebrew tap. So there are binaries, a container registry, and a package manager, and the Homebrew tap lives in its own repository rather than in this one.
That last detail has a practical edge: a version bump has to be published in two places, and a tap in a separate repository is a thing that can drift silently from the release it points at.
A module with no domain path, and three libraries pinned from an earlier era
The Go module is named with a bare word and no host path, which is legal for a module nobody imports and is worth knowing if you ever try to consume it as a library. It declares a recent language version, and then a dependency set that is a mix of current and old.
The web framework is pinned to a version from well before that language release, and two of the low level system packages are pinned to the same old minor line that shipped years ago. Nothing is wrong with either, and a dashboard that serves HTML does not need the newest router. But a module requiring a 2026 toolchain while carrying 2023 dependencies is a shape worth recognising, because it tells you the pins are conservative rather than accidentally current.
The persistence layer is more interesting. There are two SQLite drivers declared: a cgo binding declared directly, and the ORM's own SQLite driver, which wraps that same binding by default. That duplication is not an error, since one is used through the ORM and one is available directly, but it means the cgo toolchain is a build requirement, which is why the container build installs a compiler and enables cgo explicitly.
Then there is a database resolver plugin, which is the ORM's hook for read and write splitting. In an application whose entire persistence layer is one SQLite file on one volume, that is a curious thing to carry, and the page does not explain what it is for.
The container runs as a named non-root user and health-checks its own path
The container build is three stages and the details are the kind that separate a maintained image from a convenient one.
The front end is built first on a current Node alpine image, with a lockfile-driven install and a build script. The Go stage copies only the two source directories the binary needs, plus the built front end output and the file that embeds it, and enables cgo with a compiler installed, then builds a stripped binary with a version string injected through linker flags and a default of dev.
The final stage is a current alpine base with certificate and time zone data plus a privilege-dropping helper. It creates a system group and a system user, makes a data directory, and hands ownership of that directory to the new user, so the container never runs as root. The binary and the entrypoint script are copied in, and the script is stripped of carriage returns and made executable, which is what you do to a shell script that has been through a Windows editor at least once.
Two more details worth copying into your own image. A named volume is declared for the data directory, which is the SQLite file's home. And the health check is a single spider request against a health path, where the port and the base path are interpolated from the same environment variables the application reads, so a deployment on a subpath does not silently fail its own health check.
The port exposed is 8080 and the command is the binary, with the entrypoint handling the privilege drop.
The structure block in the documentation ends mid-word
The developer reference is folded away, and inside it there is a plain text block mapping the ten internal packages to their jobs:
cmd/server/              Application entry point
internal/api/            HTTP routes and handlers
internal/app/            Application wiring and startup
internal/auth/           Sessions and access control
internal/poller/         CPA usage and metadata synchronization
internal/repository/     SQLite persistence and aggregations
internal/service/        Usage, pricing, and identity services
internal/quota/          Provider quota refresh and inspection
internal/ranking/        Community ranking aggregation and sync
internal/benchmark/      Capacity suite, reports, manifests, and lega
The mapping is clean: an entry point, HTTP routes, application wiring, sessions and access control, a poller for synchronising usage and metadata from the proxy, a repository for persistence and aggregation, services for usage, pricing, and identity, a quota package for refresh and inspection, a ranking package for community data, and a benchmark package for a capacity suite, reports, and manifests.
The last line of that block stops in the middle of its final word, after four letters that are evidently the start of a longer term. It is committed that way in the readme rather than being a rendering artefact, which is a small thing, and it is the kind of small thing that tells you a file has been edited by many hands and reviewed by fewer.
The build targets in the same section are more interesting. A single verify target fans out to a backend check that runs the Go tests across the entry point and internal packages, and a front end check that does a lockfile install and then test, lint, typecheck, and build. The container build is a separate target and is not part of the default, which is a deliberate choice: a fast inner loop that does not need Docker, and a slower one that does.
Both the local prerequisites and the container build agree on the toolchain, asking for a current Go and a current Node.
Editorial conclusion
Start from what this thing holds, because that determines where it belongs. It is configured with the proxy's management key, it records per key and per provider usage, it can export request details, and by its own feature list it can refresh quotas and change credential priorities on the proxy. That is a control plane credential sitting next to a dashboard, not a read-only observer. Four things to check before you deploy it. Whether the dashboard is reachable from anywhere you do not control, since the listen host ships empty, which the example file describes as listening on all available interfaces, and the guidance is to narrow it at the host port rather than in the app. Whether the login password is set, since protection is on by default and the documented way to disable it is an environment variable with a condition attached. Whether the database directory is on storage that is backed up, since that file is the only copy of your usage and quota history. And whether the collection warning has been read, because a misconfigured collector mode stops the data rather than degrading it.
Frequently asked questions
What is CPA Usage Keeper?
A standalone dashboard for CLIProxyAPI, the upstream proxy. It keeps usage history in SQLite with scheduled backups, breaks usage, caching, and estimated cost down by model, API key, and provider, records request details with success rate and latency, and tracks credential health and remaining quota.
Do I have to change the proxy configuration before using CPA Usage Keeper?
Yes. Usage statistics must be enabled on the proxy first. The setting is observability.usage.usage-statistics-enabled in current configurations and a top-level usage-statistics-enabled in older ones. The page also warns that when several collectors share one proxy they must all use subscription mode, or collection stops or becomes incomplete.
Is CPA Usage Keeper protected by a login?
Login protection is enabled by default and you configure a login password before starting it. Setting AUTH_ENABLED to false switches it off, which the page says should only be done when access is already reliably isolated by the deployment environment. It can also share a read-only usage view scoped to a single API key.
Can CPA Usage Keeper change anything on the proxy?
Yes. The feature list includes refreshing quotas and editing credential priorities, alongside a quota history view for one provider. It is configured with the proxy's management key as a required value, so it is a control plane component rather than a read-only observer.
How do I deploy CPA Usage Keeper?
Six documented paths: a compose file for a new proxy plus dashboard, a keeper-only compose stack for an existing proxy, a plain container run, Homebrew on macOS, a Linux binary, and a Windows binary. Containers are built for amd64 and arm64 on Linux, and the page also links a package registry image and a separate repository holding the Homebrew tap.
What does CPA Usage Keeper listen on by default?
The listen host variable is empty, which the example environment file says preserves the behaviour of listening on all available interfaces, on port 8080. For a native install it suggests loopback; for containers it says to leave it empty and restrict access through the published host port instead.
Official sources
Add this badge to your README
If you maintain this project, the badge below links readers to this analysis and shows its maintenance status from the daily GitHub snapshot. Paste the markdown into your README; add ?metric=license or ?metric=stars to the image URL for a different field.

[](https://hysenlabs.com/projects/willxup-cpa-usage-keeper)Star history chart for your README
[](https://hysenlabs.com/projects/willxup-cpa-usage-keeper)Was this useful?